▶️ Intro : Let Me Be
On the previous post we continued our journey with a more complex scenario, using a mix of gdb and valgrind to trace all the function execution inside a given binary.
This time, hold on because we’re cranking up the complexity. We’ll dive deeper into low-level analysis and explore how to use Intel PIN, a powerful dynamic instrumentation framework for manipulating and inspecting executable code at runtime.
 (Photo by FURQAN KHURSHID)
Let’s start with a basic C program, that changes behavior depending on command line arguments:
🎯 The target: Gonna Make You Sweat
#include <stdio.h>
#include <stdlib.h>

int add(int a, int b) { return a+b; }
int mul(int a, int b) { return a*b; }

int main(int argc, char **argv)
{
    if (argc < 3) {
        // must input 2 number args
        fprintf(stderr, "input 2 numbers for calc add or mul.\n");
        fprintf(stderr, "Usage) ./a.out 1 2\n");
        return -1;
    }

    int a = atoi(argv[1]);
    int b = atoi(argv[2]);

    if (a < b) {
        printf("the answer is a + b = %d\n", add(a, b));
    } else  {
        printf("the answer is a * b = %d\n", mul(a, b));
    }

    return 0;
}
Then we compile it and it will be our test bed
$ cc -g -gdwarf-4 main.c -o cov_sample
$ example/cov_sample 7 3
the answer is a * b = 21
$ example/cov_sample 2 5
the answer is a + b = 7
We’re compiling with the -g flag to embed debug information directly into the executable. While this isn’t strictly required - Pin can also work with external debug symbol files - it simplifies our example.
📌 A tracing tool: Surrender
Intel PIN is a dynamic binary instrumentation framework for the the IA-32 and x86-64 instruction-set architectures that enables the creation of dynamic program analysis tools. Pin is provided and supported by Intel, free of charge for any type of use, under the terms of the Intel Simplified Software License (ISSL). All source code contained in the Pin kit, including scripts, sample code and headers, is governed by the MIT license.
Pin allows a tool to insert arbitrary code (written in C or C++) in arbitrary places in the executable. The code is added dynamically while the executable is running. This also makes it possible to attach Pin to an already running process.
Pin provides a rich API that abstracts away the underlying instruction set idiosyncracies and allows context information such as register contents to be passed to the injected code as parameters. Pin automatically saves and restores the registers that are overwritten by the injected code so the application continues to work. Limited access to symbol and debug information is available as well.
Without further ado, let’s see how a pintool looks like:
/* FuncTracer.cpp */
#include "pin.H"
#include <iostream>

// This function is called before every function in the instrumented application.
// It logs the process ID, image name, and function name.
VOID log_function_call(const char *img_name, const char *func_name)
{
    // ...
}

// Pin calls this function for every image loaded into the process's address space.
// An image is either an executable or a shared library.
VOID ImageLoad(IMG img, VOID *v)
{
    // We iterate through all the routines (functions) in the image.
    for (SEC sec = IMG_SecHead(img); SEC_Valid(sec); sec = SEC_Next(sec))
    {
        for (RTN rtn = SEC_RtnHead(sec); RTN_Valid(rtn); rtn = RTN_Next(rtn))
        {
            std::stringstream ss;
            RTN_Open(rtn);
            ss << "[Image:" << IMG_Name(img) << "] [Function:" << RTN_Name(rtn) << "]\n" ;
            LOG(ss.str());
            // For each routine, we insert a call to our analysis function `log_function_call`.
            RTN_InsertCall(rtn, IPOINT_BEFORE, (AFUNPTR)log_function_call,
                           IARG_PTR, IMG_Name(img).c_str(),
                           IARG_PTR, RTN_Name(rtn).c_str(),
                           IARG_END);

            RTN_Close(rtn);
        }
    }
}

int main(int argc, char *argv[])
{
    PIN_InitSymbols();
    if (PIN_Init(argc, argv))
    {
        std::cerr << "PIN_Init failed" << std::endl;
        return 1;
    }
    // Register the function to be called for every loaded image.
    IMG_AddInstrumentFunction(ImageLoad, 0);
    PIN_StartProgram();
    return 0;
}
(this is a stripped down version, the complete program is available on my repository). Many thanks to @simotin13 for providing a valuable starting point!
We need to compile this program in a shared .so library, following the documentation ; if you are lazy or eager, you will find an handy build.sh script and Makefiles to properly compile and link everything.
💌 What is logged ?
Now we can run pin, passing it our plugin, and execute the target, which will be injected with our instrumentation code.
export PIN_ROOT = <your PIN install directory>
$PIN_ROOT/pin -t ./obj-intel64/FuncTracer.so -- example/cov_sample 7 3
This command runs our target binary under Pin’s control, using our new custom probe. It creates a log file (pintool.log) with a detailed trace. Let’s look at a snippet of the output:
Pin: pin-3.31-98869-fa6f126a8
Copyright 2002-2024 Intel Corporation.
 [tid:10367] [Image:/home/andrea/CodeCoverage/example/cov_sample] [Function:_init]
 [tid:10367] [Image:/home/andrea/CodeCoverage/example/cov_sample] [Function:.plt]
 [tid:10367] [Image:/home/andrea/CodeCoverage/example/cov_sample] [Function:printf@plt]
 [tid:10367] [Image:/home/andrea/CodeCoverage/example/cov_sample] [Function:atoi@plt]
 [tid:10367] [Image:/home/andrea/CodeCoverage/example/cov_sample] [Function:fwrite@plt]
 [tid:10367] [Image:/home/andrea/CodeCoverage/example/cov_sample] [Function:_start]
 [tid:10367] [Image:/home/andrea/CodeCoverage/example/cov_sample] [Function:_dl_relocate_static_pie]
 [tid:10367] [Image:/home/andrea/CodeCoverage/example/cov_sample] [Function:deregister_tm_clones]
 [tid:10367] [Image:/home/andrea/CodeCoverage/example/cov_sample] [Function:register_tm_clones]
 [tid:10367] [Image:/home/andrea/CodeCoverage/example/cov_sample] [Function:__do_global_dtors_aux]
 [tid:10367] [Image:/home/andrea/CodeCoverage/example/cov_sample] [Function:frame_dummy]
 [tid:10367] [Image:/home/andrea/CodeCoverage/example/cov_sample] [Function:main]
 [tid:10367] [Image:/home/andrea/CodeCoverage/example/cov_sample] [Function:add]
 [tid:10367] [Image:/home/andrea/CodeCoverage/example/cov_sample] [Function:mul]
 [tid:10367] [Image:/home/andrea/CodeCoverage/example/cov_sample] [Function:_fini]
 [tid:10367] [Image:/lib64/ld-linux-x86-64.so.2] [Function:_dl_call_libc_early_init.cold]
 [tid:10367] [Image:/lib64/ld-linux-x86-64.so.2] [Function:remove_slotinfo.cold]
 [tid:10367] [Image:/lib64/ld-linux-x86-64.so.2] [Function:_dl_close_worker.cold]
 [tid:10367] [Image:/lib64/ld-linux-x86-64.so.2] [Function:_dl_map_object_deps.cold]
 [tid:10367] [Image:/lib64/ld-linux-x86-64.so.2] [Function:_dl_fini.cold]
 [tid:10367] [Image:/lib64/ld-linux-x86-64.so.2] [Function:call_init.cold]
 [tid:10367] [Image:/lib64/ld-linux-x86-64.so.2] [Function:_dl_notify_new_object.cold]
 [tid:10367] [Image:/lib64/ld-linux-x86-64.so.2] [Function:add_name_to_object.isra.0.cold]
 [tid:10367] [Image:/lib64/ld-linux-x86-64.so.2] [Function:expand_dynamic_string_token.cold]
 [tid:10367] [Image:/lib64/ld-linux-x86-64.so.2] [Function:_dl_init_paths.cold]
 [tid:10367] [Image:/lib64/ld-linux-x86-64.so.2] [Function:_dl_map_object_from_fd.cold]
 [tid:10367] [Image:/lib64/ld-linux-x86-64.so.2] [Function:_dl_map_object.cold]
 [tid:10367] [Image:/lib64/ld-linux-x86-64.so.2] [Function:_dl_lookup_symbol_x.cold]
 [tid:10367] [Image:/lib64/ld-linux-x86-64.so.2] [Function:__minimal_realloc.cold]
 [tid:10367] [Image:/lib64/ld-linux-x86-64.so.2] [Function:_dl_new_object.cold]
 [tid:10367] [Image:/lib64/ld-linux-x86-64.so.2] [Function:add_to_global_update.cold]
...
 [tid:10367] [PID:10367] [Image:/lib64/libc.so.6] [Called:pthread_mutex_unlock]
 [tid:10367] [PID:10367] [Image:/lib64/libc.so.6] [Called:__GI___pthread_mutex_unlock_usercnt]
 [tid:10367] [PID:10367] [Image:/lib64/ld-linux-x86-64.so.2] [Called:_dl_call_fini]
 [tid:10367] [PID:10367] [Image:/home/andrea/CodeCoverage/example/cov_sample] [Called:__do_global_dtors_aux]
 [tid:10367] [PID:10367] [Image:/home/andrea/CodeCoverage/example/cov_sample] [Called:deregister_tm_clones]
 [tid:10367] [PID:10367] [Image:/home/andrea/CodeCoverage/example/cov_sample] [Called:_fini]
 [tid:10367] [PID:10367] [Image:/lib64/ld-linux-x86-64.so.2] [Called:_dl_audit_objclose]
 [tid:10367] [PID:10367] [Image:/lib64/ld-linux-x86-64.so.2] [Called:_dl_call_fini]
 [tid:10367] [PID:10367] [Image:/lib64/ld-linux-x86-64.so.2] [Called:_dl_audit_objclose]
 [tid:10367] [PID:10367] [Image:/lib64/ld-linux-x86-64.so.2] [Called:_dl_call_fini]
 [tid:10367] [PID:10367] [Image:/lib64/ld-linux-x86-64.so.2] [Called:_dl_audit_objclose]
 [tid:10367] [PID:10367] [Image:/lib64/ld-linux-x86-64.so.2] [Called:_dl_audit_activity_nsid]
Since the log contains both the list of all functions of our binary, and the functions that has been executed, it’s easy to cook up a script that emits a fancy coverage report.
==================================================
Image: /home/andrea/CodeCoverage/example/cov_sample
==================================================
  Functions Found:   15
  Functions Called:  12
  Coverage:          80.00%
--------------------------------------------------
  Called Functions:
    - .plt
    - __do_global_dtors_aux
    - _fini
    - _init
    - _start
    - atoi@plt
    - deregister_tm_clones
    - frame_dummy
    - main
    - add
    - printf@plt
    - register_tm_clones

  Uncalled Functions:
    - _dl_relocate_static_pie
    - mul
    - fwrite@plt
and with some markup:
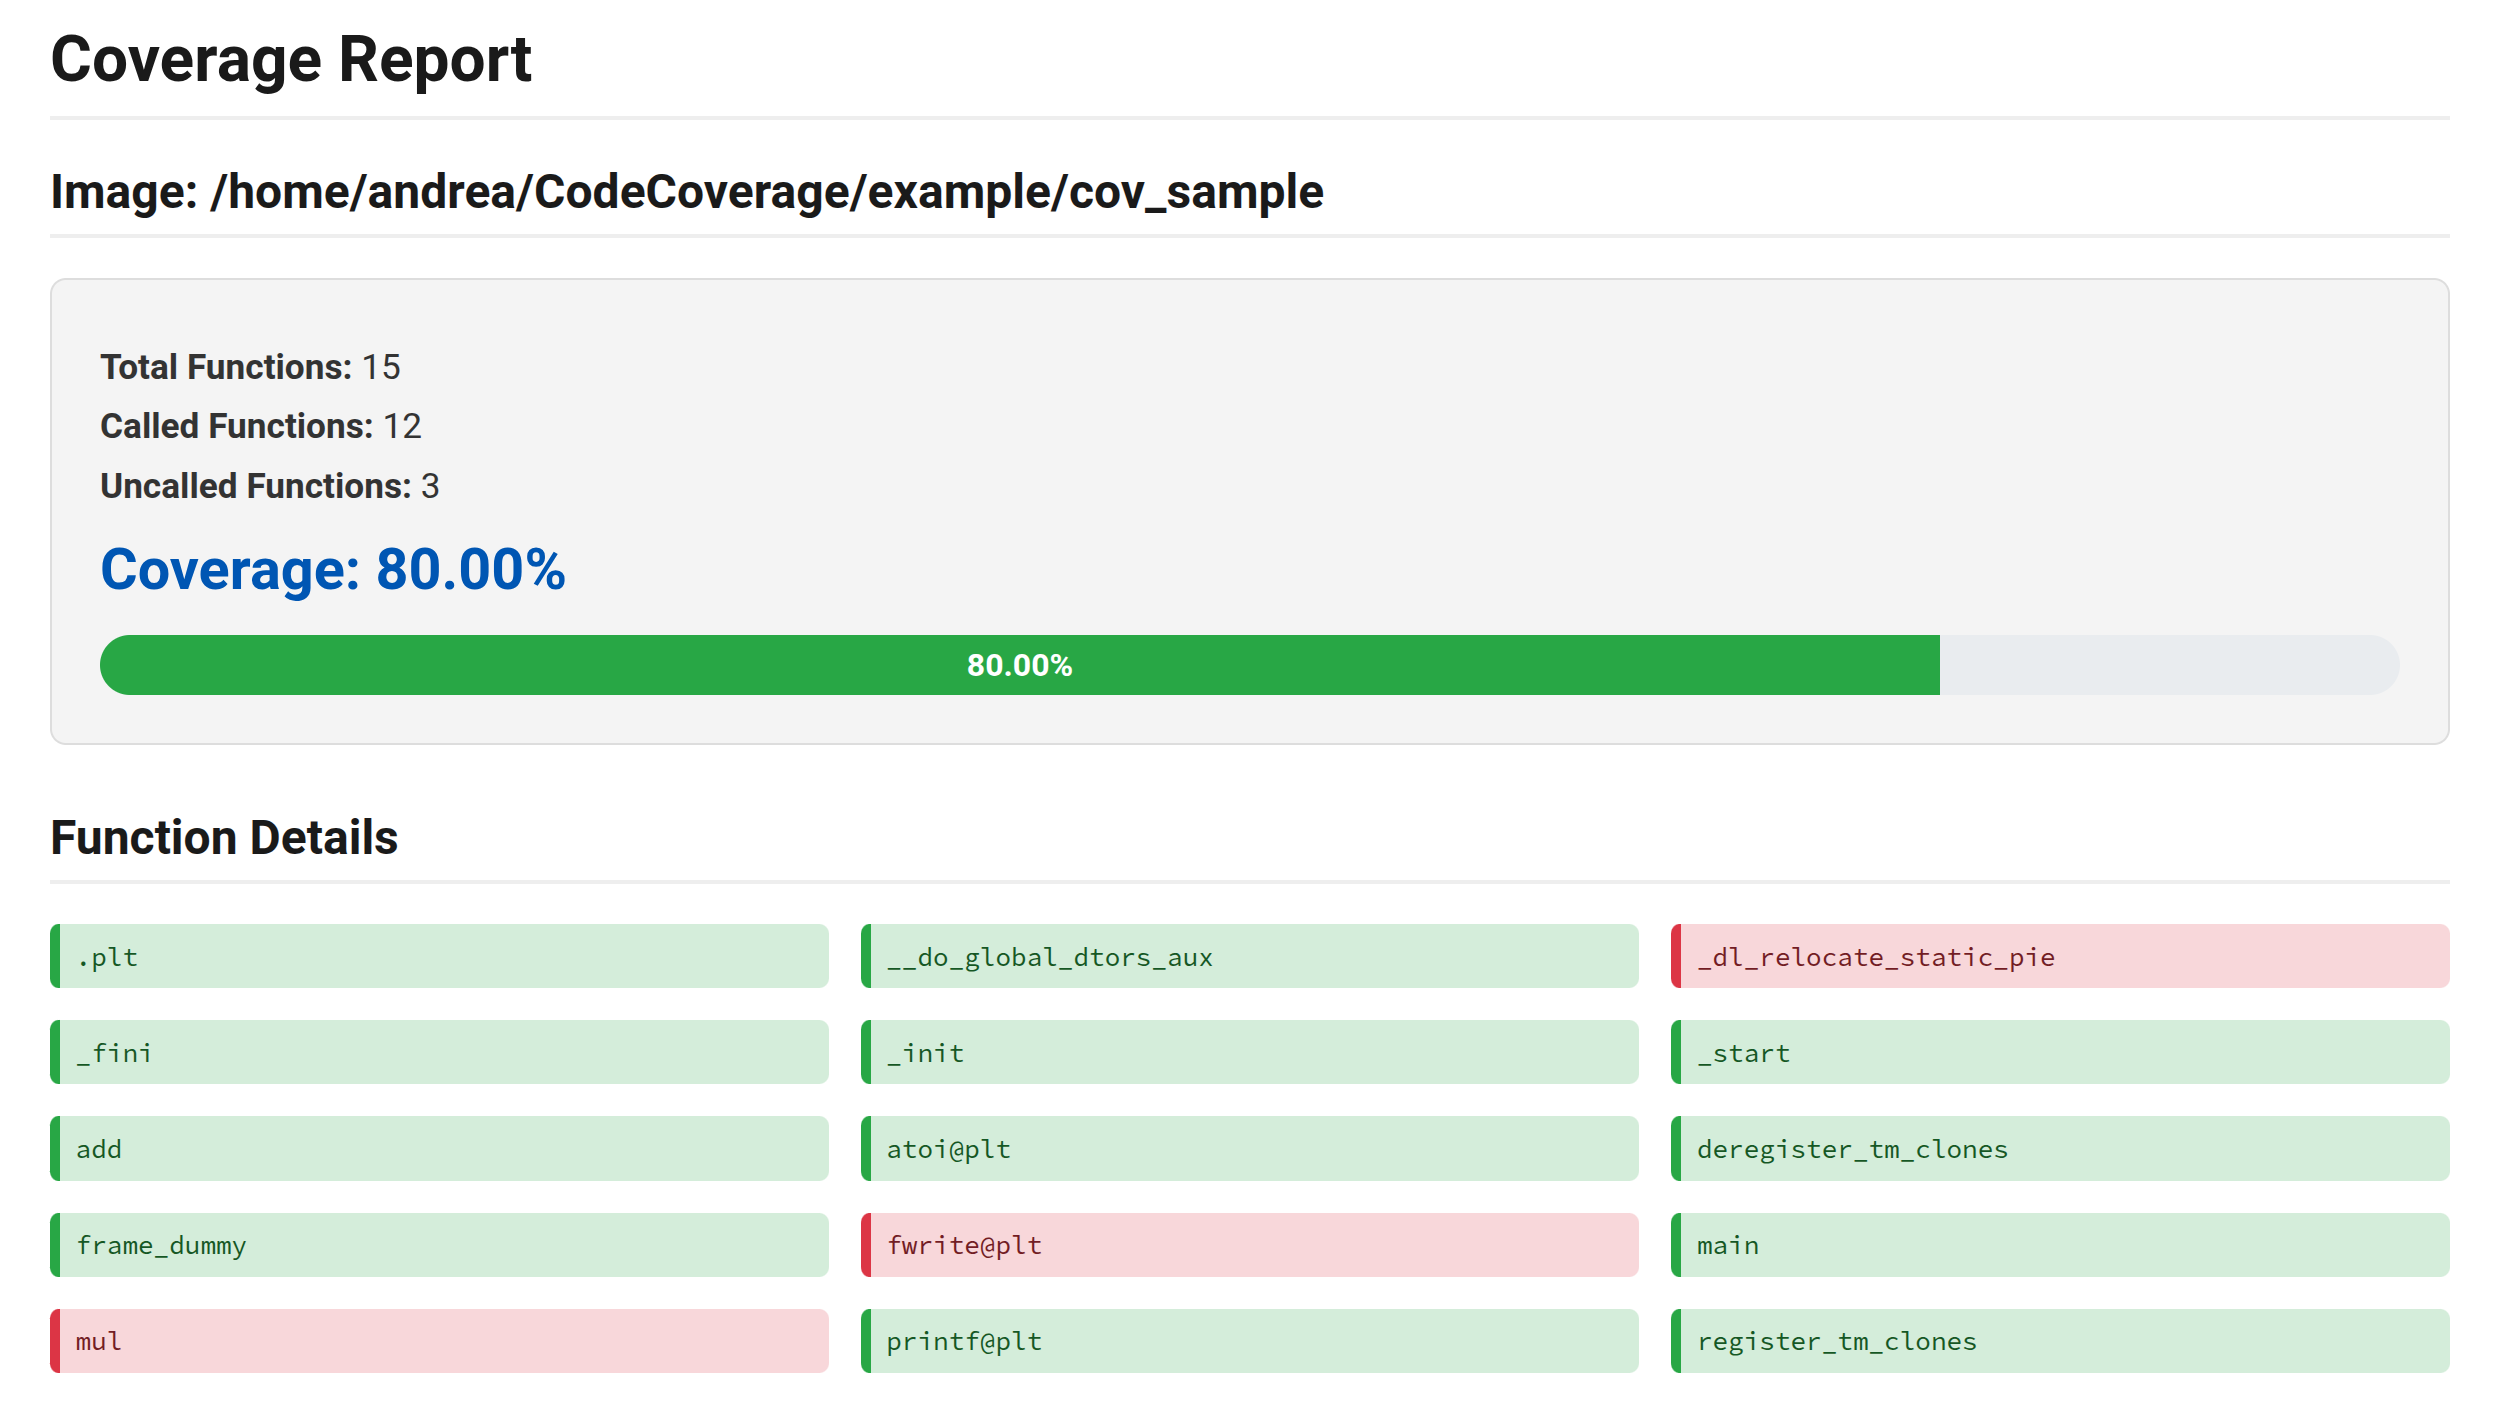
now we also have an hint of where is better to focus our testing, because some of the program functions have not been called.
As an improvement, we could prepare a “whitelist” of functions that are intrinsic to the execution environment (like main, _start and so on) that can be excluded from the report.
🪩 Going further
On the repository you can find some bonus content:
- a Python program that analyzes the log and outputs the coverage reports
- a convenient
wrap.shutility that takes a binary, replaces it with the proper instrumentation call, and then optionally restore the previous state.
Next step: instead of a dummy target, we’ll “measure” operating system binaries, with full automation and without the need of recompilation. Never give (U) up 🙂↔️
p.s. If you didn’t notice: as a summer easter egg, every section of this post is an Eurodance 90 song 🎧 Enjoy!